
On this page
- What does days on market mean in vehicle listings data?
- Which VinAudit listing fields help explain duration?
- Why Observation Windows Change the Result
- How gaps, relisting and cross-listing affect the clock
- Does a removed vehicle listing mean it is sold?
- How to Compare Listing Duration Fairly
- What price history adds—and what it cannot explain
- Choose data access around the analysis
- Frequently asked questions
TL;DR Vehicle listings data measures observed advertising exposure, not verified time to sale. Define the observation window and account for gaps, removals, relistings, and duplicate advertisements before comparing durations. A disappeared listing does not prove a sale or ownership change.
Vehicle listings data can show how long a vehicle has been observed in advertisements, how its asking price has changed, and when it stops appearing in covered sources. Those observations can help dealers, analysts and pricing teams decide which inventory deserves a closer look.
They do not, by themselves, establish when the vehicle sold, what a buyer paid, or whether ownership changed. To use days on market responsibly, define what starts and stops the clock, which records count, and how gaps and repeat listings are handled.
What does days on market mean in vehicle listings data?
In a listings analysis, days on market should describe a clearly defined period of observed advertising exposure. The phrase alone does not tell readers whether a number measures current listing age, an ended advertising episode, or several episodes for the same vehicle.
Keep these measures separate:
| Measure | What It Measures | Evidence Needed |
|---|---|---|
| Current Listing Age | Time from the defined starting observation to the analysis date for active inventory. | A stated start, analysis date, and active-status rule. |
| Observed Listing Duration | Span or exposure for a defined advertising episode. | Listing observations and declared counting, gap, and episode rules. |
| Days on Lot | Time in a dealer’s inventory. | Inventory arrival/departure records if physical stock age is intended. |
| Days to Sale | Time ending at a confirmed transaction. | A defined start and independent transaction evidence. |
| Market Days Supply | Inventory relative to a selling rate; supply coverage, not one vehicle’s age. | Defined inventory, selling-rate period, and competitive criteria. |
vAuto’s inventory FAQ explains that market days supply also depends on competitive criteria.
CarGurus’ January 2025 glossary illustrates why definitions matter: it separates days on market for month-end listings from days to turn for vehicles that departed. Two reports can use similar language while measuring different groups.
Which VinAudit listing fields help explain duration?
The VinAudit Market Listings API reference documents the following fields. These are observation and listing fields, not transaction confirmations.
| Field | Documented Meaning |
|---|---|
listing_date |
First seen online |
date_max |
Most recent sighting |
date_dropped |
Confirmed no longer listed |
days_seen |
Span from first to last sighting |
listing_status |
active, in-transit or dropped |
price_history |
Dated historical prices |
The reference describes active as listed within the last five days, in-transit as pending sale while the vehicle is being transported, and dropped as no longer actively listed and likely sold. These are status labels, not transaction records: “likely” is not a confirmed sale, and no rate for how often it holds is published. Dropped listings are returned only when listing_status requests them, and the history_days parameter sets their lookback, with a default of 30 days. These rules should travel with any exported analysis.
Do not assume days_seen counts distinct days successfully observed or proves uninterrupted availability. In the reference, listing_date is the first sighting and date_max the most recent one. Both documented examples are consistent with an inclusive calendar count between them: a listing first seen September 10 and last seen November 2 shows a days_seen of 54. The reference doesn’t say how gaps or relisting affect it.
Why Observation Windows Change the Result
First seen means first observed within the relevant collection history. It need not be the first day the seller advertised the vehicle anywhere. A source added recently, an earlier missing record, or a limited historical extract can shorten what is visible.
Last seen is an observation date. A later confirmation that the listing has dropped answers a different question. Neither date independently identifies the transaction date. Because active is defined by a five-day window, use date_max rather than status alone to judge the most recent sighting.
Consider a reporting window that begins after an advertisement was already running. The available observations cannot recover its earlier exposure without additional history. At the other boundary, a vehicle still listed when the report closes has an unfinished episode.
That unfinished episode is analogous to right-censored data: the observation period ends before the event being measured occurs. NIST explains the general statistical principle; applying it to listings does not turn removal into a sale event.
For a practical report, show current active ages separately from ended observed episodes. Excluding every still-active vehicle can omit long-running inventory; mixing its current age with completed durations answers neither question cleanly. Daily snapshots also leave uncertainty about changes between observations. Daily data is not real-time.
How gaps, relisting and cross-listing affect the clock
Define the unit before calculating duration. A vehicle, an advertisement, a seller’s inventory episode and a source page are different units.
A continuous observed episode has no missing observations under the analyst’s stated rules. An interrupted episode contains a gap. Relisting means a vehicle appears again after an apparent end or interruption. Cross-listing means the same vehicle is advertised through multiple sources.
The timeline contrasts observed dates with the calendar span for one hypothetical VIN.
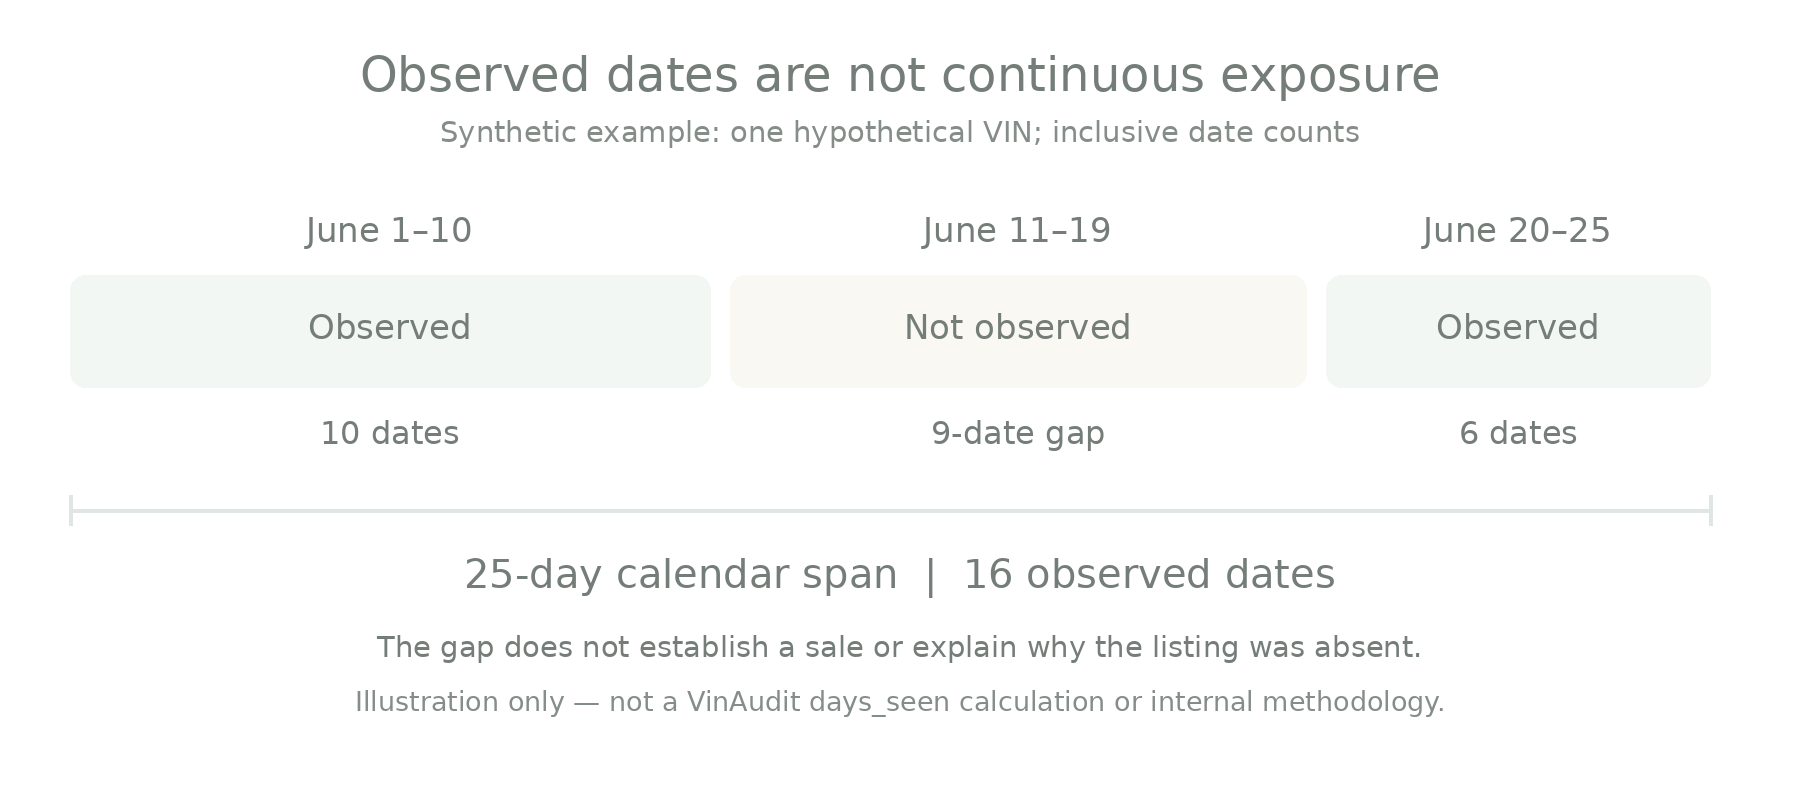
Figure 1. Synthetic observation example: June 1–10 and June 20–25 contain 16 observed dates across a 25-day calendar span. The nine-date gap does not establish a sale. This is not a VinAudit days_seen calculation or a description of internal methodology.
Neither number establishes 25 continuous days of advertising. Nor does the gap prove the vehicle was sold and returned. An analyst could retain two episodes or apply a documented gap-tolerance rule. The report should identify that choice instead of silently treating the span as continuous exposure.
VIN-level deduplication helps prevent several advertisements for one vehicle from becoming several vehicles in a count. Preserve the underlying source, seller and episode relationships, however: collapsing everything into one row can hide the very interruptions or seller differences being investigated. Records without a usable VIN need a separate matching policy and should not be presented as confidently deduplicated.
Does a removed vehicle listing mean it is sold?
Not by itself. VinAudit’s reference labels a dropped listing as likely sold, but that is a qualitative inference. Removal establishes that a listing is no longer observed as active under the source’s rules. A completed sale is one possible explanation; withdrawal, a changed advertisement or a collection gap are other possibilities to investigate.
A status change does not establish a negotiated price, buyer identity, ownership transfer or completed payment. Label the finding as removed or dropped inventory unless separate evidence supports a stronger conclusion.
How to Compare Listing Duration Fairly
A comparison becomes useful when the groups are similar enough that a duration difference deserves investigation. Start with the business question—such as which local inventory needs a pricing review—then set the comparison rules before inspecting the result.
| Comparison Factor | Align or Disclose | Why It Matters |
|---|---|---|
| Geography and Timing | Use comparable markets and calendar periods; document source-coverage changes. | Different locations, periods, or coverage can change the visible inventory. |
| Vehicle Attributes | Align year, make, model, trim, powertrain, and relevant equipment; use mileage bands and condition/history where available. Disclose missing controls. | Vehicle mix and unobserved condition can explain duration differences. |
| Seller and Listing Type | Separate franchise, independent, and private sellers; new, used, and certified listings. API defaults cover new/used/certified and franchise/independent; request private sellers explicitly. | A default query and an expanded query may represent different populations. |
| Price Position | Use contemporaneous alternatives and state initial versus latest price. listing_price is latest; price_history may begin after the first sighting. |
Asking prices and their timing affect the comparison; they are not transaction prices. |
| Observation Rules | Use the same lookback, statuses, date definitions, gap policy, and relisting treatment. | Different clocks create different duration measures. |
| Counting and Summaries | Distinguish listings from unique vehicles; disclose exclusions and sample size; report a median and spread. | Duplicate records and a single average can obscure the distribution. |
Source for the product-specific defaults and price fields: Market Listings API reference. Comparison choices are analytical guidance.
If the cohort is too small, broaden it transparently or report that the evidence is insufficient. A national group may be informative, but it should not quietly replace a local comparison. Missing condition data should remain a limitation rather than being treated as equal condition.
Longer exposure can justify reviewing price position, merchandising or sourcing fit. It does not identify the cause. Shorter exposure likewise does not prove stronger demand when the comparison mixes different vehicles or observation rules.
What price history adds—and what it cannot explain
Dated asking-price changes add context to an advertising episode. A useful review can ask whether a vehicle’s advertised price moved closer to comparable inventory and whether it remained visible afterward.
A price reduction followed by removal does not prove the reduction caused a sale. The final asking price is not necessarily the transaction price. Differences associated with mileage should not be labeled depreciation unless age, trim, condition, geography and other factors have been isolated.
Choose data access around the analysis
The VinAudit Market Listings API returns listing dates, status and dated price history for listings that match a filtered query, including dropped listings when requested. The VinAudit Total Market Feed delivers daily bulk listing datasets and historical listing records, with VIN-level normalization supporting raw-listing and unified-vehicle views
Use targeted queries when reviewing a defined market or set of records. Consider a recurring bulk dataset when you need repeatable snapshots and control over a larger analytical history. Confirm the actual schema, history scope and identity rules for the delivery you will use.
Frequently asked questions
Is days_seen the same as days to sell?
No. An observed listing span does not establish a confirmed sale date.
Is first seen the date the vehicle was first advertised?
Not necessarily. It is the first date the vehicle was observed in the collected sources. The seller may have advertised it earlier, on a source added later, or before the available history begins.
Does relisting reset days on market?
That depends on the dataset and the analyst’s definition. Document whether the measure follows one episode, one seller or a vehicle across multiple episodes.
Why do two sources show different durations?
They may observe different sources or dates, use different lookbacks, or handle gaps and repeat records differently. Compare definitions before comparing numbers.
What can a long or short listing duration suggest?
Within a well-matched cohort, a vehicle advertised much longer than its peers is a prompt to check whether its asking price sits above comparable listings, whether its photos and description are complete, and whether it fits the local market. Across a segment, shorter typical durations can be consistent with stronger demand or tighter supply, and longer ones with the reverse. A gap between regions may reflect seller mix or source coverage as much as demand. Treat each reading as a question to test against price position and inventory levels, not a conclusion.
What is a good days-on-market number?
There is no universal threshold established by this guide. Evaluate a defined, comparable cohort and explain the observation rules before using duration to prioritize a business decision.
Before acting on a duration comparison, make sure another analyst can reproduce its unit, dates, cohort and exclusions. That is the point at which the metric becomes a useful review tool.
Review the Market Listings API and its documentation for targeted listing queries, or the Total Market Feed for recurring bulk snapshots, against the observation rules your analysis needs.